

 A new Eurekahedge report shows that Asia ex-Japan mandate funds delivered the best returns globally during March 2015. Asia ex-Japan as a whole was up 2.08%: Greater China focused funds were up 4.85%, leading the region.
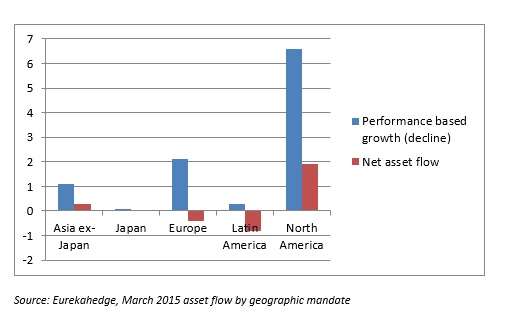
The region’s funds held $148.6 billion in AUM as March began. They made a little more than $1 billion through performance, and received net inflows of $0.3 billion. Europe and Latin America mandated funds, on the other hand, both had net outflows during the month.
Japan mandated funds were flat as to net flow, and nearly flat as to performance growth.
The asset flows by geographical mandate are displayed in this graph, an adaptation of Figure 2 from the Eurekahedge report (the numbers along the Y axis indicate US$ billions).
Looking at the performance of the industry globally, Eurekahedge says that hedge funds returned $54.1 billion in performance gains for the first quarter. These are the highest-first quarter gains since before the global financial crisis. Total industry assets under management now approach $2.2 trillion.
March was a third consecutive month of gains, “returning 0.78% and outperforming underlying markets as the MSCI World Index finished the month down 0.39%.”
Taking the underlying equity markets by region: Europe and Japan saw gains overall, while the U.S. saw a retreat, which Eurekahedge attributes to weak durables data and the possibility that the stronger U.S. dollar is starting to bite the real U.S. economy.
Strategic Mandate
Breaking down hedge funds by strategy rather than region, the only negative performance for March came from Arbitrage funds. And that was a stunning turnaround, because arb funds had had a very good February.
The best performing strategies in March were: CTA/managed futures; macro; long/short equities. Managed futures fund performance also represented a turnaround, though a happy one: they were rebounding from a very lackluster February. The macro managers were reaping a harvest sown by the central-bank currency wars. All this competitive quantitative easing has created exploitable inefficiencies.
In that connection, too, Eurekahedge observes that markets no longer expect the U.S. Federal Reserve to raise rates in the second quarter: that will likely happen in the third or fourth quarter of this year. The strength of the dollar is seen as the problem, and continued low rates as the solution.
Combining geography and strategy, arb’s negative month is due entirely to North America. The strategy’s losses there more than consumed its gains in Europe.
The Eurekahedge event driven index was up 0.71% in March. All the regional variants of this strategic mandate were up, with the Asia ex-Japan region doing the best in the event-driven world. There has been a lot of merger and acquisition activity around the world of late. Indeed, 2015 first quarter M&A activity is up 23% from the same period a year before. In the Asia ex-Japan region, the equity markets and the IPO activity in Greater China has been very marked and they have helped the funds with this mandate.
A Wider Timeline
The report concludes with an overview of “trends in Asian hedge funds” in recent years. For this purpose, Eurekahedge breaks down the universe by AUM. It finds that the percentage of funds managing up to $100 million in Asia has remained high over the years. The authors suggest that this is because funds don’t really graduate out of that size: investors who aren’t already in small funds shy away from moving in that direction. The small stay small.
Further, there has been an overall decline in the AUM in the region as managers have rebalanced their portfolios since 2007.
One trend the report observes is the decline in allocation to single-country mandated funds, because managers are seeking to diversify their geographical exposure. Too much reliance on Japan, or India, or Korea, is a bad idea.
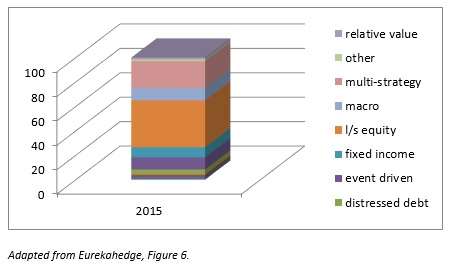
Another trend involves strategic break-downs. The Asian hedge fund industry has seen a 16% decline in the number of long/short equity funds since 2007. In part this is because L/S equity funds are closely correlated with the underlying equity market, and managers want to diversify away from that. As the graph above indicates, though, l/s equity remains a hefty piece of the whole: 38.51%.